So Portland has a problem with affordable housing. Rents are high and increasing, which sucks for all those looking for rental housing (and is great for those with property to rent) and property values are soaring which is great for those who own homes but bad for those that want to buy. Politicians hear the complaints and want to avoid being seen as passive so they try to come up with policies that sound good to voters. Unfortunately, these ideas are generally half-baked and done without nearly enough research and thought. And poor policy can have bad consequences.
Thus we have this proposal from City Commissioner Chloe Eudaly with the support of Mayor Ted Wheeler. This proposal would require landlords to pay the moving costs of tenants evicted for "no-cause." The idea is to discourage such evictions. The actual result is most likely to make the rental housing situation worse.
How so? Well first let's start with the premise that no-cause evictions are part of the problem of unaffordable housing. Perhaps, but Oregon has a statewide ban on rent control policies, so why is getting a new tenant any better than raising the rent on an existing tenant? Especially when you factor in the cost of a vacant apartment or house, the cost of getting it ready for a new tenant, etc. It is not at all clear why this policy would help at all.
Second, rental housing is a market and markets adjust to distortions created by policymakers. This policy clearly raises the cost of doing business for landlords. So who pays for these increased costs? All students of economics learn from their very first class that the incidence of taxes and other distortions are shared. Increased costs shift the supply curve back and a new equilibrium results. How does that new equilibrium compare to the old one? Higher price and fewer properties rented. Exactly the opposite of what commissioners say they want to see in the rental market.
Third, there is the incentive to create more rental housing. What Portland needs more than anything are new rental units to increase supply or shift the supply curve out. More units would do the opposite of the above: it would lower price and increase units rented.
Finally, this policy creates advantages for sitting tenants and disadvantages those looking for rental housing. If landlords are less likely to evict tenants, tenants are prone to stay longer in rental housing and those wanting housing will find less to rent. Why are we placing the interests of one group above another group?
And by the way, I know a little of what I speak. I have two papers on these types of 'soft' rent control policies that are designed to protect sitting tenants:
"The Economics of Tenancy Rent Control." (w/ Kaushik Basu) The Economic Journal, October 2000, Vol. 110, No. 466, pp. 939-962.
"Efficiency Pricing, Tenancy Rent Control and Monopolistic Landlords." (w/ Kaushik Basu) Economica, May 2003, Vol. 70, No. 278, pp. 223-232.
If you really want to help the rental housing market the first thing you should do as a policy maker is to do no harm: don't start distorting markets without considering the consequences. The second is to promote the creation of new rental housing if you really want to help. But I have a message to policy makers: the good news is that the market is promoting the creation of new housing right now without your input at all - it is called high rents. So by all means do what you can to speed the construction of new housing, especially housing targets to lower income renters, but please don't resort to bad populist ideas.
Tuesday, January 24, 2017
Wednesday, January 18, 2017
Yes, January Was Cold, But...

My other adopted hometown, São Paulo, Brazil was more than 5 degrees hotter and precipitation was more than 19 inches less than normal. Ouch.
Tuesday, January 17, 2017
School Choice and Efficiency: A Note
The nomination by Donald Trump of Betsy DeVos for Education secretary has put school choice and vouchers back in the forefront of the national debate about school reform. Vouchers are often touted by more conservative groups as a way to bring competitive pressures and market discipline to education by empowering families to make choices regarding their children's education.
This is simply a note to point out that a key, even crucial, component of market efficiency is complete information. Consumers must know everything about the product they are purchasing including hoe beneficial it is to themselves, the prices of all goods in the market and so on.
Education is far from this. Education experts are still trying to figure out the critical components of educational outcomes, how can uninformed families, who only observe schools from the tousled make well-informed decisions for their kids? Simply put, they can't. Thus there is absolutely known reason to believe that we will improve efficiency through the introduction of vouchers, school choice or charter schools.
This is not to say that there could not be beneficial outcomes from such reforms, I remain open-minded, but don't tout the creation of an education market as the answer for it is likely to be inefficient.
Thursday, January 5, 2017
Happy New Tax Year
Fred Thompson checks in with a New Years post

With the start of another
legislative session, calls for wholesale tax reform are again being heard.
Frankly, most state tax-policy specialists are dubious of big reforms. My
Georgia State University colleague, Carolyn Bourdeaux, for example, boils the typical
reform process down to the following seven steps:
1.
Form a commission
2.
Develop “Principles of Tax Reform”
3.
Hold hearings
4.
Make a proposal based either on the “grass is
greener assumption” or the “bold new thinking on taxes notion.”
The former looks like this:
·
If your state does not have an income tax, propose
an income tax
·
If your state does not have a retail
sales/consumption tax, propose a sales tax
·
If your state has a corporate income tax, propose
a gross receipts tax
·
If your state has a gross receipts tax, propose
a corporate income tax
The latter looks like this:
·
If your state relies on personal and/or
corporate income taxes, propose the elimination of all exemptions, credits, and
deductions
·
If your state relies on retail sales taxes,
propose to tax services and internet sales
·
If your state relies on both sales and income
taxes, propose to replace them with a value-added tax or mess with local
government revenues
5.
If you choose from the first list, your state
will probably be no better off than it was before and possibly worse; from the
second, you will probably see your proposal go down in flames
6.
Wait 5-10 years until the next fiscal crisis
7.
Repeat.
The fact is that wholesale tax
reform is more often than not a mug’s game, especially in Oregon, which has one
of the country’s best state and local tax systems. At least that is the
consensus among state and local tax specialists. It’s not by any means perfect;
what is? But it’s better than what you find elsewhere.

So, instead of talking about
wholesale tax reform, what should we talk about? The answers are simple: first,
fix the things that need fixing, we know what those things are; second, if the
state needs more money, increase the rates on existing taxes; third, funds are
inherently limited, set spending priorities and stick to them.
What needs fixing? More than
anything else, Patrick
Emerson and I have written about
the Kicker and its
folly here at the Oregon Economics Blog. In what is largely an exemplary
state and local tax system, Oregon’s kicker is an embarrassment, or, more
correctly, the legislature’s unwillingness to deal with it is simply shameful.
There is also the problem of kicking the can down the road with respect to maintaining
and upgrading state and local transportation infrastructure, where the best
that can be said is that Oregon
is probably better than many places, but that still isn’t very good.
Moreover, the state has emphasized its needs at the expense of local
governments, which, given the network
aspects of our transportation grid, is foolishly suboptimal. Finally, the
legislature has handed out tens of billions of dollars in business and personal
income tax deductions and exemptions, usually with the best of intentions –
promoting economic development, conservation, or other worthwhile activities –
but tax expenditures are all too often ineffective and excessively costly. Many
if not most of these loopholes/subsidies should be repealed (which is, of
course, easier to say than to do).
Beyond these measures, if more
funds are needed, raise income and business tax rates. By far the worst thing
about Measure 97 was the size of the jump it proposed – a 2,500 percent rate
increase. It makes sense to consider a more incremental increase in the
alternative minimum turnover tax rate, while retaining
the offset provision for C-corps.
Boosting taxes requires
compromise. Oregonians care about schools and roads, but they are also
inherently thrifty, if not actually cheap. At a minimum, support for K-12 and
highway spending must be prioritized ahead of other state programs and initiatives.
Moreover, cost-saving reforms to the state’s public pension system probably ought
to be on the agenda as well. Upholding contracts is one thing, guaranteeing
unanticipated windfalls another. If kicker reform, together with other tax
increases, are on the table, pension inflation adjustments, especially those which
exceed the realized rate of inflation, probably ought to be as well.
Holding broadly valued, highly
esteemed programs hostage to special interests is often a winning legislative
tactic, but, in the longer run, it’s bad politics, one that the governor
acquiesces to at her peril.
Wednesday, December 14, 2016
Fred Thompson: Steve Novick's First-of-Its-Kind CEO Tax
Fred Thompson checks in with another well researched post (unlike mine)

 Portland’s
so-called Business
License Fee (BLF) levies a 2.5 percent tax on the adjusted net profits of
about 43,000 companies operating in the city. Starting in 2018, Portland will impose
a surcharge to this tax on some large, publicly owned C-corporations. The
surcharge will apply to businesses, which are subject to the Dodd-Frank
requirement that they disclose the ratio of their chief executive’s (CEO)
compensation to the compensation of their median employee and which also
have high compensation ratios. Portland’s department of revenue estimates that about
550 Portland businesses will be subject to this reporting requirement. Where reported
compensation ratios are equal to or greater than 100, businesses will pay a 10
percent surcharge on their BLF (2.75 percent tax rate); equal to or greater
than 250 times, a 25 percent surcharge (3.125 percent).
Portland’s
so-called Business
License Fee (BLF) levies a 2.5 percent tax on the adjusted net profits of
about 43,000 companies operating in the city. Starting in 2018, Portland will impose
a surcharge to this tax on some large, publicly owned C-corporations. The
surcharge will apply to businesses, which are subject to the Dodd-Frank
requirement that they disclose the ratio of their chief executive’s (CEO)
compensation to the compensation of their median employee and which also
have high compensation ratios. Portland’s department of revenue estimates that about
550 Portland businesses will be subject to this reporting requirement. Where reported
compensation ratios are equal to or greater than 100, businesses will pay a 10
percent surcharge on their BLF (2.75 percent tax rate); equal to or greater
than 250 times, a 25 percent surcharge (3.125 percent).
Portland’s BLF generates about
$60 million in revenue per annum. The
municipal revenue office estimates that the >500 businesses subject to Dodd-Frank
compensation-ratio reporting contribute about one-third of BLF revenue, nearly $20
million per annum, and that the
surcharge will boost municipal revenue by $2.5-$3.5 million per year, which
implies that nearly all the reporting businesses will be subject to the
surcharge, at least one-third of them at the 3.125 percent rate.
This is a novel tax experiment.
As Branko Milanović explained: “What
I find quite interesting is that it seems [to be] the first tax that targets
inequality as such.” For Milanović, it’s novel because “it treats
inequality as having a negative externality, like taxing carbon emissions.”
Moreover, it isn’t at all clear how Portland’s experiment will play out, which
makes it interesting, albeit probably still not in itself materially significant.
Policy experimentation is cool, especially elsewhere.
The remainder of this post will
focus on two issues:
1.
What is the purpose of this measure? Will it work?
2.
Are the municipal revenue estimates realistic?
Portland spends about $30
million per annum on low-income
housing and homeless services. The revenue from the surcharge will be
contributed to fighting homelessness, where presumably every bit will help.
Moreover, this use of the funds, when combined with its source, ought to
reinforce the symbolic power of the measure.
There is an implicit
presumption that the measure will cause businesses (some C-corps, anyway) to moderate
CEO compensation or boost median earnings. No doubt executive compensation
plays a major explanatory role in the explosion in income inequality that has
occurred over the past 30-40 years. Forbes
magazine recently reported that the average annual total compensation for a Fortune 500 CEO was $10.5 million. This
breaks down to $3.5 million in salary and bonus, $3.8 million in other
compensation such as personal perk packages, and $3.2 million from exercising
vested stock options and awards.
 |
| Source: Economic Policy Institute |
However, compared to the
combined total compensation of Fortune 500 CEOs
of $5.2 billion, the $3 million that Portland expects to collect through this
measure looks like a drop in the ocean. Unless a lot other jurisdictions follow
Portland’s lead, it isn’t likely to meaningfully influence corporate
compensation practices, one way or the other.
Furthermore, it is possible that
Portland won’t even collect $3 million from this measure. As is the case with a
lot of things, CEO compensation tends to be characterized by a Pareto
distribution, i.e., 20 percent of CEOs get 80 percent of total compensation.
That implies an average compensation for the 400 CEOs at the bottom of the Fortune 500 list of about $2.5 million
each, well under the $4 million Portland used to estimate the cutoff for the
surcharge. When compared with the average median worker compensation in Fortune 500 companies of about $80,000,
which boosts the cutoff to $8 million, this implies that considerably less than
half of Portland’s top C-corps will be on the hook for the surcharge. Moreover,
looking only at the average median worker entirely omits from consideration the
possibility that Bloom et al. are correct, that
two-thirds of the rise in earnings inequality from 1978 to 2013 was due to increases
occurring between businesses, not within them – let alone all the shadier expedients
mandatory disclosers could avail themselves of to minimize reported compensation
ratios.
Thursday, December 1, 2016
Silicon Valley's Relentless Hype About Disruption is Questionable: The Case of Uber
Despite the hype, I have never been convinced by Uber, there is a reason taxi companies formed and is wasn't just radio dispatch. Other things such as ability to select and keep skilled drivers, economizing on capital stock, insurance and maintenance seemed to me party powerful economic forces.
Uber's premise is essentially that there need be no more central control thanks to smartphones and that there is no such thing as economies of scale in taxi service. The former might be right, but the latter is questionable.
Now there is this exposé of Uber in the blog Naked Capitalism, nicely covered by the Financial Times' Alphaville blog. It appears that Uber is one, losing money at an astonishing rate, and two, engaging in predatory pricing - deliberately pricing below cost to drive competitors out of business.
Wednesday, November 23, 2016
How You Get Away With a Lousy Public Education System
By many metrics Oregon has one of the worst public education systems in the Untied States. Oregon's per-pupil funding is 15% below the U.S. average, Oregon's low graduation rates are 48th worst in the nation, Oregon has the highest absentee rate, and one of the shortest school years in the nation and we have below average standardized test scores in math and reading. And yet, Oregon's economy is doing well, we have a tech sector and a creative sector that are doing well and we are constantly seen as an attractive place to locate.
It is this last bit that is the key: if you are a complete failure in educating your own children, you better be good at importing educated young people from other states. Luckily, we are.
So next time you get all worked up about the relentless migration of young people and families from California and other parts of the U.S., remember that without them, we'd have to rely on the poorly educated sons and daughters of Oregon. Woe the thought.
Tuesday, November 22, 2016
Back to Blogging.....about Soccer
It has been a very long hiatus - I have had a series of things that have demanded my time and taken me away from blogging. But through industry, time and fate I suddenly find myself (and by sudden I mean as of today) with a more manageable work-load and my thoughts drift to going back to doing some stuff I enjoy. I imagine that I have lost nearly all my audience, which is okay, it is actually a lot easier to write when I imagine no one is reading, but I thank Fred Thompson for single-handedly keeping this thing alive and preserving a small audience of super-wonks....
...which I will now do my best to alienate. I'd love to come back hard with a deep-dive into some state policy topic, an extended piece on my interpretation of the economic impacts of a Trump presidency but that would short-circuit my start before it even began because I would find it too daunting and not fun enough. So I come back with thoughts on one of my favorite pastimes: soccer.

Yesterday the US Soccer Federation decided to fire the coach of the national team and its Technical Director, Jurgen Klinsmann. Bruce Arena, onetime coach of the US National Team and current LA Galaxy coach will be hired as his replacement. To me this represents a switch back from the aspirational to the pragmatic and I, for one, am disappointed. I am not sold on Klinsmann being a great coach, in fact I am pretty sure he is not. But I think that is secondary to his role as an aspirational leader for the direction of the USSF.
In the past, and continuing to the present, elite soccer in the US has been built on two things: pay-to-play and athleticism. Because of the socio-economic inequalities, this has caused the exclusion of youth from immigrant communities where technical ability and flair is prized and soccer IQ is extremely high. It has promoted the advancement of big-fast-strong soccer robots who are taught to play very directly, do a set few things and limit their independent thought. The problem with this approach is that the game based on direct-play, athleticism and lack of autonomy is boring to play, boring to watch and ever less competitive in top-flight professional soccer. And yet our entire national soccer mechanism incentivizes exactly this. This is a very coach-centric approach and is a spill over, I think, of the sports culture of the US which is based on coaches being in charge. But soccer is pretty unique in that it is not like that at all. Once the game begins the coach has almost no control- it is up to the players to figure it out themselves.
So the US National Team in the past has reflected this culture and the American coaches hired to coach the team have been very good, very pragmatic coaches. They know the talent they have and they know how to maximize it - play direct counter-attacking soccer that relies on athleticism. That is a fine an defensible approach but it reinforces the problem: there is too little emphasis on technical quality and intelligent play. As the US team is a model for kids in this country much more than the pro leagues (unlike most of the world) it only causes an exacerbation of the problem. It is an emphasis on winning, full stop.
What Klinsmann represented to me was the idea that we could and should strive to be more. That we should aspire to create intelligent technical players, that we could play an attacking style with flair and skill, that we could keep possession of the ball and complete with the best. What I think Klinsmann recognized is that without a native soccer culture and as the touchstone for all of US soccer, the National team had the unique power to be the agent of change in the US. To become an aspirational model for what US soccer could look like. This is why, I believe, he looked so hard for players in Europe who were more technical and intelligent, to show the way to younger players.
He did a lot to move the USSF along behind the scenes as the Technical Director - from the youngest ages on up. As a youth coach myself, I have seen the changes first-hand and though I don't always agree, I mostly do and I see the results every weekend as every year (and this past fall in particular with a number of rule changes, the most important being that U11 and U12 players play 9v9) I see more and more teams playing a possession-style game and eschewing the direct play that used to be the norm. But there is a long way to go: the very elite levels of youth soccer are still results-based and thus the all too easy shortcut of selecting on aggressiveness and athleticism still wins the day. They are also extremely expensive and exclude the very best talent which is in poorer immigrant communities (largely Latin American but not exclusively). So we have still have a very long way to go and the youth clubs themselves, whose existence is based on the pay-to-play model, will resist change. This is why an iconic figure like Klinsmann was important - he had the power of persuasion to get all the thousands of clubs (and the USSF) itself moving on down the road. In other countries there are soccer clubs with senior teams that compete in an open system with promotion and relegation where there are incentives for the clubs to find and develop players, in the US it has to come from the top.
So now we are back to pragmatism. I hear the term 'American style' of play - as in 'Klinsmann did not understand the American style and thus players were uncomfortable and under-performed.' To me this is just saying that all American players are good at is running and fitness so don't ask them to do more or be more. Apparently, that is what we are going back to. If that is a good thing for soccer players, why are there so few Americans playing in European professional leagues? American exceptionalism does not translate to soccer and I lament the passing of the Klinsmann era.
Monday, October 31, 2016
Fred Thompson: Last Thoughts on M-97 (if it is defeated)
Fred Thompson checks in with another post on M-97
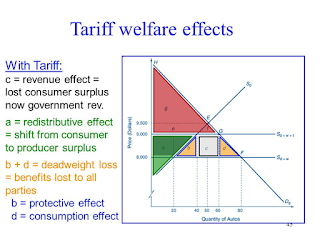
I dislike M-97. Sufficiency aside, it violates all of the
criteria that for 40 years I have taught my students should be employed to
evaluate tax proposals: Neutrality, Efficiency, Horizontal and Vertical equity,
Transparency, and Certainty. Most tax proposals envision some tradeoffs between
these criteria. M-97 abuses them all.
Nevertheless, Yes on
97 looks to be more right than not on three points. M-97 would be good for
small businesses (and big LLCs and S-corps), most of the new money will be
spent on education and health, and, going back to at least 2003, the state has
failed to prioritize education funding. Even where it has increased education
funding it has too often directed monies to special interest projects or
categorical programs, more frequently it has simply imposed mandates on
schools. These have often bled resources away from district priorities, but
have not measurably promoted student learning or welfare. What it has not done
is stabilize school funding or support it at a satisfactory level.

I think M-97 is a wretched mess, although I acknowledge it
could work out fine. Nobody knows; the simple fact is that state taxes per se usually don’t matter very much to
the health of state economies. My fellow economists, who have thought about the
effects of M-97, and I believe that the best real-world analogy to how it would
work is an ad valorem tariff.
Depending on market structure and the economic power of the businesses subject
to tariffs, they can be partly, fully, or more than fully passed through to
final (domestic) consumers. If they are high enough, they can cause foreign
competitors to exit domestic markets. On occasion, foreign businesses are
forced to eat the full tariff themselves, which is what yes on 97 says will happen, pretty much across the board. Of
course, M-97 would be good for non-C-corps, including small businesses, for
precisely the same reason that tariffs are good for some domestic producers:
they let them increase their prices without losing market share.

Finally. I have talked to folks who agree that M-97 is a train
wreck waiting to happen, but plan to vote for it nevertheless. Their logic goes
something like this: its threat will push the legislature to put together a
higher yielding (and perhaps sounder) tax system than the one we have now. I
see their logic, but I don't see a path from this ugly thing to a sound tax
system (historically, gross receipts taxes have simply devolved into retail
sales taxes). It's rather like M-47, which was a mess; in M-50 the legislature
made it into something OK, but by no means ideal, or even close. I also recall
that Willamette Week, in supporting
Measure 5 in 1990, argued that it would force the legislature to confront the
need for fundamental tax and school finance reform. Evidently, Willamette Week learned better. It
opposes M-97.
Subscribe to:
Posts (Atom)